Kort fortalt giver metoden muligheden for at se det enkle i det komplekse. CLD er en del af metoderne indenfor System Dynamics som de fleste af os mest kender via Forrester effekten (piskesmælds-effekten i supply chain). Tilgangen har også mange relationer til Systems Thinking.
I denne artikel, som de to har skrevet til Effektivitet, er der, forsøgt at give en kort introduktion til metoden via praktiske eksempler indenfor supply chain.
Jens Foldager
Introduction
With the increase in technology, globalization, and international competitiveness, supply chains have understandably increased in complexity to adapt. Likewise, our understanding of how to effectively manage these supply chains has evolved with the introduction of this same complexity into how business is conducted throughout the world. These changes have prompted managers to make both logical and seemingly illogical or contradictory decisions. For example, let’s examine the logical evolution of the practice of awarding business to the lowest cost suppliers. Under what we will refer to as the “traditional approach” to supply management, suppliers were seen as a source of costs that needed to be controlled and minimized as much as possible. When the quality movement of the 80’s and 90’s started to take hold, experts like W. Edwards Deming and Joseph Juran pointed out that the quality of your products and services are directly tied to the quality of the goods and services used to produce and support them. As such, the practice of squeezing suppliers and pushing them to lower costs was counterproductive. In his famous 14 Points of Management, Deming outright warned against awarding business on price alone. The result of this warning, along with concerns over supplier quality, prompted the need for the development of quality auditing systems such as ISO 9000 to assure industrial customers had more comprehensive ways to assess supplier performance.
At the about the same time, the Lean Production approach popularized in Japan started to make consumers more value sensitive. Consumers began demanding both high quality and lower price. This made the traditional practice of producers setting prices simply by adding a predetermined margin to production costs no longer acceptable. Customers came to expect a certain level of value and price was determined by the market based on those expectations. Once again, managers went in search of low cost suppliers, with a significant twist. Now the low cost suppliers were found in the emerging industrial countries like China & India. Global outsourcing (a.k.a. offshoring) was the solution de jour.
As expected, with the significant growth in business and jobs, the standard of living in these developing countries started to rise and wages along with them. In addition, increased transportation distances resulted in the increased likelihood of supply disruptions due to a vast variety of global events such as the volcanic eruptions in Iceland, Tsunamis off the coast of Japan, and pirates off the coast of Somalia. In addition, consumers have become more aware of and concerned over the inhumane employment practices conducted in third world countries. Large companies like Nike, Apple, and Walmart have all experienced the downsides of being associated with operations employing inhumane methods in their global supply chains, thus making them more sensitive to finding suppliers that won’t tarnish their well-earned reputations. As a result, today many of these same supply chain managers are now scrambling to find local suppliers closer to home (a.k.a. on-shoring or insourcing).
The above scenario illustrates the inevitable dance that all managers experience when trying to deal with a large complex system by using analysis to react to events in the short term. Rather than reacting to whatever market forces are dominant at the moment, managers must develop more proactive methods for constructing their supply chains. Instead of swinging back and forth between outsourcing and insourcing we need to move toward intelligent sourcing (Fine 2013).
A prerequisite to what Fine refers to as intelli-sourcing is the ability to see the bigger picture and effectively communicate this knowledge to others. Fortunately, the field of System Dynamics offers a simple tool called the Causal Loop Diagram (CLD) that can assist supply chain managers in accomplishing these objectives. In this paper we will introduce the CLD tool and use it to demonstrate how the tool can be used to effectively depict complex supply chain behaviors.
Causal loop diagrams
The CLD is a tool that enables individuals to visualize how the actions they take ripple through a complex system and eventually come back to influence future actions. In short, they help us to visualize the role we play in creating and shaping the environments we work within. As one learns how to create a CLD, they improve their ability to organize and articulate their own understanding about the behavior of the systems within which they operate. As individuals share and discuss their diagrams with others, they are able to acquire diverse perspectives on the phenomena they are experiencing and refine their understanding of the real system’s behavior.
CLDs are composed of two basic types of causal loops. One of these loops is referred to as a reinforcing loop and the other is a balancing loop. These basic loops are created when two or more variables are linked together using arrows which result in a closed loop. In each of these links, the variable at the back of the arrow is said to cause a change in the behavior of the variable the arrow points to. The direction of change between the variables is depicted using either a + or – sign. A + sign means that the two variables change in the same direction while a – sign means that the two variables change in opposite directions. For example, if more customers are buying our products, our organization will make more money (+ sign). Likewise, if demand for our products decreases, so will our profitability. Similarly, two variables linked by an arrow with a – sign and is read as moving in opposite directions. For example, if the demand for our products increase, the inventory in the supply chain decreases OR if demand for our product decreases, supply chain inventory increases (- sign). To illustrate the concept of a causal loop diagram consider a simple example depicting one scenario that helped create the rapid move toward the use of suppliers in third-world countries (see Figure 1). The diagram is read as follows:
Starting outside the loop increasing Customer Value Expectations causes producers to increase the Use of Low Cost International Suppliers. As a result supply chains incur more geographic spread and transportation distances correspondingly increase. As the distance material travels increases, the opportunities for supply chain disruptions increase, which drives the need for even more suppliers to offset the risk of a supply shortage. The loop drives a boom in the search for and development of third world suppliers.
Since all the links in the connections in Figure 1 are positive, it is classified as a reinforcing loop. The outside factor, Customer Value Expectations, kicks the loop into spinning in an ever growing direction. Two points need to be considered with this illustration. First, this loop is very simplified and there are certainly additional factors that should be included to more fully depict the off-shoring dynamic. Adding such factors will be demonstrated in the next section of the paper. Secondly, Customer Value Expectations would certainly be part of another feeding causal loop. That loop is not shown because it is not necessary for this particular example, however, managers could easily develop that loop as well and show how it feeds into the Off-shoring loop. The main point of this discussion is that CLDs are a dynamic rather than static tool that can be modified and adapted as the environment changes. As more people contribute to their development, and as insights into the system’s behavior grows, so does the CLD. The CLD serves as a physical representation of the shared understanding or mental model of the group, which facilitates further discussion and team learning.
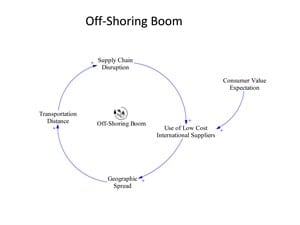
Figure1 – The Off-Shoring Boom Loop
Archeltype CLDS
CLDs have been used to create System Archetypes. System Archetypes are generic structures of recognizable patterns that commonly occur in a variety of settings. Because they represent recognizable system behavior, archetypes are often used as the foundation for customized causal loop diagrams developed by a group investigating a specific situation within an organization. In this section of the paper we will use two common archetypes to illustrate and examine two complex dynamics that commonly occur in supply chains.
Limits To Growth
One common system behavior that most of us intuitively acknowledge is that nothing will increase forever. This behavior has resulted in the development of a System Archetype called Limits to Growth. The Off-shoring example above is an excellent scenario to illustrate the Limits to Growth archetype and explain one factor that caused producers to move away from offshoring. Figure 2 shows the Limits to Growth archetype applied to the Off-Shoring example. This diagram has a second loop labeled The Off-Shoring Bust Loop. This loop is read as follows: The increased Use of Low Cost International Suppliers can result in the Selection Of Suppliers Using Inhumane Practices. Eventually some event, such as the recent tragic collapse of the factory in Bangladesh, occurs and exposes the inhumane practices. This causes Consumer Sensitivity to Inhumane Practices to increase. Consumers worldwide question why retailers are doing business with such organizations. This often results in a large group of consumers collectively responding through Boycotts and Other Negative Consumer Behaviors. The most recognizable organizations such as Walmart, Apple, or Nike at the end of the supply chain are compelled to take action to decrease the Use of Low Cost International Suppliers
The Off-Shoring Bust Loop in Figure 2 is considered a balancing loop due to the negative link between the two variables Boycotts and Other Negative Consumer Behaviors and Use of Low Cost International Suppliers. Balancing loops can move in either direction, meaning that as time passes and the outrage over specific events will die down consumer sensitivity to inhumane practices subsides and eventually may result in companies returning to the use of more Low Cost International Suppliers thus starting the Boom cycle again.
The two diagrams in Figures 1 & 2 depict one explanation for the movement toward, then away from, off-shoring. As more people get involved in developing the CLD additional factors will be identified and the diagram can be further expanded to include more and more cause and effect relationships. Managers can use the diagrams to explain their thinking to others and further solidify their understanding of complex system dynamics. We will next discuss the use of CLDs and another type of System Archetype to examine a relatively new and complex phenomenon in SCM, Vertical Competition.
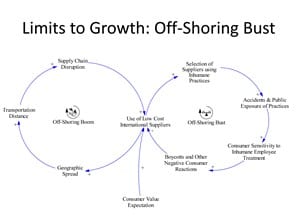
Figure 2 – The Off-Shoring Bust Loop
Vertical Competition and Accidental Adversaries
Business competition is traditionally considered to be horizontal in nature, meaning two firms offering the same product or service attempt to win market share at the other’s expense. As organizations started to link together to form supply chains, the concept of vertical competition emerged. Vertical competition occurs when two firms at different stages of the supply chain become competitors. This can happen in two ways. The first is similar to horizontal competition in that the firms become competitors offering the same product or service. This usually occurs because a customer within a supply chain has difficulty finding a supplier to meet its specific needs. Without sources to satisfy its specific requirements, the customer ends up developing the capabilities in-house and eventually going into competition with what was once a supplier. The second form of Vertical Competition is more subtle and defines competition in a more general way. Here competition is defined as two or more parties seeking to gain the same thing at the same time. This occurs when one part of a supply chain tries to maximize its profits, market share, and span of influence by applying pressure on another part of the supply chain.
The System Archetype called Accidental Adversaries can be used to illustrate both situations. The Accidental Adversaries Archetype is used to represent situations where two organizations initially form a mutually beneficial relationship. Over time as one party pursues activities to maximize its own success it causes them to take action which ultimately hurts the other party. This in turn causes the other party to respond accordingly and eventually the beneficial relationship turns adversarial.
To illustrate this we will share two examples. The first example relates to a company we worked with that had decided to implement Lean Production techniques to improve its competitive position. As the implementation proceeded, the company decided to break its production facility into smaller product focused work cells. These smaller cells necessitated the installation of smaller rubber mixing machines in each line rather than having just the one large machine that it had been using. When the company approached the OEM of the larger mixing machine to purchase smaller ones, they were informed that the OEM did not make smaller machines because there was not a big enough market to cost justify their production. As a result, the original Company A decided to employ its own engineers to develop and produce the smaller rubber mixing machines. Subsequently, it was discovered that there was actually a large market for these smaller machines and Company A developed a very successful “side business” to supply that market. In short, the OEM had successfully and unintentionally created a new competitor. The Accidental Adversaries CLD illustrating this dynamic is shown in Figure 3.
The archetype is composed of two reinforcing loops and two balancing loops. The large outer reinforcing loop labeled R1 Company A & OEM Help Each Other, shows the initial beneficial relationship. The two smaller inner balancing loops depict each company’s strategy for success. For example, Company A seeks to increase its success by implementing Lean Production Techniques, and the OEM seeks to mass produce high demand products. At first the different strategies do not impact each other, but as Company A gets further into its implementation it requires equipment that appears to be in conflict with the OEMs strategy of producing only high demand products. This is what creates the inner reinforcing loop R2 Adversarial Behavior causing Company A to make its own equipment and eventually going into competition with the OEM. The key here was for the OEM to recognize that the growth in the popularity of Lean Production could have created a market that they were unaware of. In short, they should have considered more deeply about the motivation of Company A and how wide spread the use of similar lean strategies might be across other industries the OEM supplied.
The second example of Vertical Competition is illustrated by a story about the interaction between Walmart and their efforts to build a supplier relationship with Snapper, which makes high quality lawn mowers. While this example involves Walmart there are many similar stories involving other major world-wide retailer and their suppliers, making this a prime scenario for an archetype. The CLD depicting the dynamics of this story are shown in Figure 4.
It is important to note the similarity between Figure 3 & 4. This is to be expected since they both use the Accidental Adversaries Archetype to explain the dynamics of the situation. While they are similar, there are also important differences as the variables are changed to reflect the specific situation. In Figure 4 the outer reinforcing loop R1 Walmart and Snapper Help Each Other again tells the story of how the relationship starts off as a mutually beneficial one. Walmart offers Snapper a large and very attractive contract that increase Snapper’s success. Snapper’s high quality reputation helps bolster Walmart’s reputation for carrying reputable products. Again, it is the inner 2 balancing loops depicting each company’s strategy for success that forms the basis for the potential adversarial relationship. Walmart’s widely publicized strategy of having “everyday low prices” pushes them to require suppliers continually lower their selling price to them. The pressure grows as the purchasing volume from Walmart increases. Foreseeing this potential, Snapper’s CEO was concerned about their long-term ability to continue to make high quality products and maintain a strong reputation in the marketplace. Seeing the potential for the adversarial relationship to evolve prompted the CEO of Snapper to initially turn down the larger contract with Walmart (Fishman 2006). Snapper now has agreed to provide only the high-end push mowers for Walmart, which are sold at a higher price allowing Snapper to maintain its profit levels.
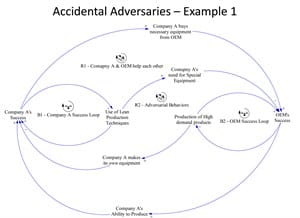
Figure 3 – Accidental Adversaries Example 1
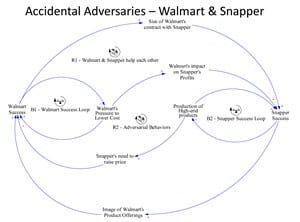
Figure 4 – Accidental Adversaries Example 2
Conclusion
This paper introduced the idea of using CLDs to better understand the behavior occurring within supply chains. While the diagrams themselves do not answer questions, they enable managers to proactively see how many factors come together to create complex and often counterintuitive system dynamics. In addition, developing these diagrams help managers gain insights, make better decisions, and share those insights more accurately with others. It also enables leaders to ask informed questions. In a continuously changing environment, the ability to ask informed questions is often more valuable than simply implementing solutions that have previously worked as those solutions may not be effective in the current environment. The examples in this paper all illustrate this point. Figures 1 and 2 illustrate that managers should seriously examine the suppliers they choose and proactively recognize the potential for big problems due to supply disruptions and their associated negative publicity. Because consumers often have a short-term memory, there is a strong temptation to return to the lowest cost suppliers when the “heat” from a bad event dissipates. Wise managers recognize that each event depletes two precious resources, consumer good-will and positive company reputation.
Similarly, the examples using the Accidental Adversaries archetype shows how sticking with past solutions can be disastrous in the long-term and managers need to proactively look at the bigger picture to make informed decisions. The key, or leverage point as it is called in system thinking, to Accidental Adversaries is for the two parties to share a common understand of the overall strategy for success each company is pursuing, then recognize how the two strategies could eventually create potentially adversarial behaviors. In the first example, the OEM did not do this and created a competitor while also losing the opportunity to capitalize on a new growing market for its products. In the second example, the CEO of Snapper was able to see the bigger picture and avoid the potential disaster that other companies did not.
References
Fine, Charles. Intelli-Sourcing to Replace Offshoring as Supply Chain Transparency Increases Journal of Supply Chain Management. Apr2013, Vol. 49 Issue 2, p6-7.
Fishman, Charles. The Man Who Said No to Walmart. Fast Company. Jan/Feb2006, Issue 102, p66-71.
J. Brian Atwater
J. Brian Atwater, PhD, CPIM, Jonah is an assistant Professor of Operations Management at Indiana University Southeast (IUS). Prior to IUS he taught for 14 years at Utah State University. He teaches courses in Systems Thinking, and Project Management. He has worked as an examiner for the Shingo Prize and has provided consulting services for several businesses including Apple, Carrier Transicold., Schuller/Manville and 3M. He may be reached by email at jbatwate@ius.edu or by phone at 812-941-2058.
Paul Pittman
Paul Pittman, Ph.D., CFPIM, CSCP, Jonah is a Professor of Operations Management at Indiana University Southeast, where his teaching has earned him numerous teaching honors including the IU distinguished teaching award. As a consulting partner in The LAMP Group (www.thelampgroup.com), Pittman assists organizations in learning and applying systemic thinking, lean and continuous improvement. He is currently a member of the APICS E&R Board of directors and past service includes the CPIM Program Chair. He is a frequent invited speaker at professional meetings and published numerous articles. Paul can be reached at ppittman@ius.edu or by phone at 812-941-2524.